Monday, June 01, 2009
NASA still hiding correlation between solar activity and temperature
NASA finally mentions the Maunder Minimum in its discussion of the current prolonged solar minimum, but it STILL does not mention that the Maunder Minimum coincided with the onset of the Little Ice Age, or that the Dalton Minimum in the early 1800's was also cold, as was the unnamed fin-de-the-1800's minimum.
Thar she blows, the Maunder Minimum of sunspot activity:
As it has done for two years now, NASA is predicting that solar cycle 24 will ramp up tomorrow. Should that broken-clock prediction hits its hour, then NASA is also predicting that solar cycle 24 will have the modest amplitude of the 1928 cycle, indicated by the red arrow.
A look at the temperature record shows the correspondence between solar activity and temperature:
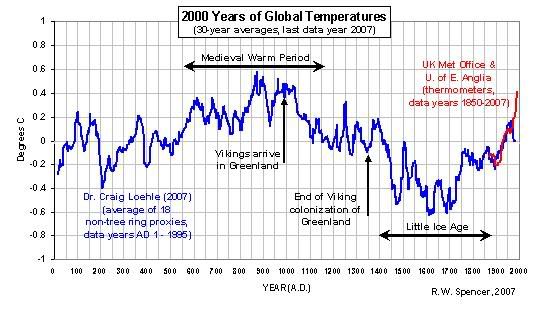
Maunder Minimum cold; Dalton minimum (just before the red thermometer-based line starts) cold; unnamed end-of-1800's minimum (first dip in red line) cold; "grand maximum" solar activity between 1920 and 2000 warm.
NASA is acutely aware of this correspondence, but is keeping John Q Public in the dark. Now that the sun has gone quiet again, the climate is cooling again, but you will never hear it from James Hansen’s underlings at NASA:
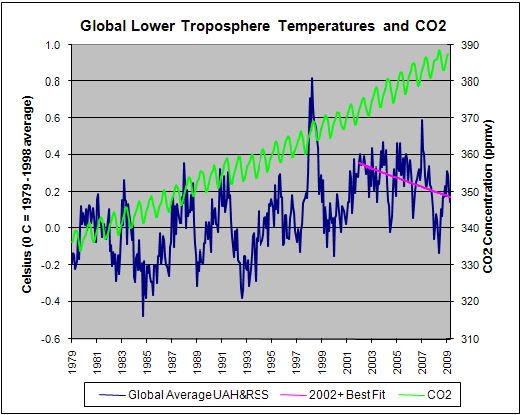
CO2 keeps going up, but temperatures are going down. NASA frowns and scratches.
Gee you tax-payer supported SOLAR SCIENTISTS, busy gaping at "the quietest sun we've seen in almost a century," if temperature is not being driven by CO2, what possibly COULD have created warming since 1910 and cooling since 2000?
Deluded people all over the world actually think the planet is still warming
This week's sky-falling headline, courtesy of the UK Times:
You'd think that the Times could bother to check with England's own climate office for something as basic as the temperature record, but the problem isn't JUST the press. Like NASA, the Hadley Centre tries to keep the most basic climate-science facts from the public. When temperatures were rising, Hadley cried the global warming threat from the rooftops. Now that the planet is cooling, they are doing their best to cover it up. Here is Hadley's current statement:
Even those who see themselves as trying to take the reasoned middle ground are misled about the most basic facts. A recent Popular Science editorial claimed that:
Presumably they mean to refer to the fact that pretty much everybody now acknowledges that there does seem to have been a small amount of warming between the late 70's and 2000, topped off by the El Nino spike of 1998. It did indeed take a while for many skeptics to acknowledge this small amount of warming, for the simple reason that it was not evident in satellite readings (as can be seen in the above graphic with the gray background), while the surface temperature records were known to be tainted with an upward temperature bias, thanks to growing "urban heat island" effects.
No clear warming signal until very late 90’s, then cooling
Pre-98, the alarmists themselves were not yet sure that temperatures were actually rising. Their theory was that CO2 should cause temperatures to rise, and they were watching like hawks for a clear warming signal that they could take as evidence that this theory was right, but it took them a while to get it. In the mid 90's, even the most radical alarmists, like NASA's James Hansen, were only talking about whether or not this predicted signal had been seen yet or not.
They even worked it out so they could claim to see CO2-caused warming in the absence of rising temperatures. Aerosols from coal burning are seen as having a cooling effect, so in the absence of CO2 warming effects, cooling would be expected. Thus so long as temperature readings were not actually showing global cooling, Hansen et. al. could claim that human release of CO2 was having a measurable warming effect. (See for instance, the 1995 IPCC report, summary of the science, p. 22, subhead 4: "The balance of evidence suggests a discernable human influence on global climate.)
With the El Nino spike, it became clear that some warming had occurred. But that was the temperature peak. Since then the surface records and the satellite records all show cooling. Thus the alarmists got essentially one data point that can be taken as supportive of their theory: the very late 90’s did show a clear warming signal. Unfortunately for them, the CO2 theory has no explanation for the rest of the temperature record.
There was no significant human production of CO2 before WWII, so the CO2 theory has no explanation for planetary warming from the Little Ice Age to the 1930s (covering about .8° of the 1°C temperature rise between the Little Ice Age and today). In contrast, the theory that solar-magnetic activity drives climate fits this emergence from Little Ice Age very well: goodbye Maunder Minimum, with hiccups at the Dalton Minimum and the fin-de-1800's minimum.
Ditto for the post-2000 cooling: it does not fit the CO2 theory at all, but fits perfectly with the theory that climate is driven by solar activity.
Thar she blows, the Maunder Minimum of sunspot activity:
As it has done for two years now, NASA is predicting that solar cycle 24 will ramp up tomorrow. Should that broken-clock prediction hits its hour, then NASA is also predicting that solar cycle 24 will have the modest amplitude of the 1928 cycle, indicated by the red arrow.
A look at the temperature record shows the correspondence between solar activity and temperature:
Maunder Minimum cold; Dalton minimum (just before the red thermometer-based line starts) cold; unnamed end-of-1800's minimum (first dip in red line) cold; "grand maximum" solar activity between 1920 and 2000 warm.
NASA is acutely aware of this correspondence, but is keeping John Q Public in the dark. Now that the sun has gone quiet again, the climate is cooling again, but you will never hear it from James Hansen’s underlings at NASA:
CO2 keeps going up, but temperatures are going down. NASA frowns and scratches.
Gee you tax-payer supported SOLAR SCIENTISTS, busy gaping at "the quietest sun we've seen in almost a century," if temperature is not being driven by CO2, what possibly COULD have created warming since 1910 and cooling since 2000?
Deluded people all over the world actually think the planet is still warming
This week's sky-falling headline, courtesy of the UK Times:
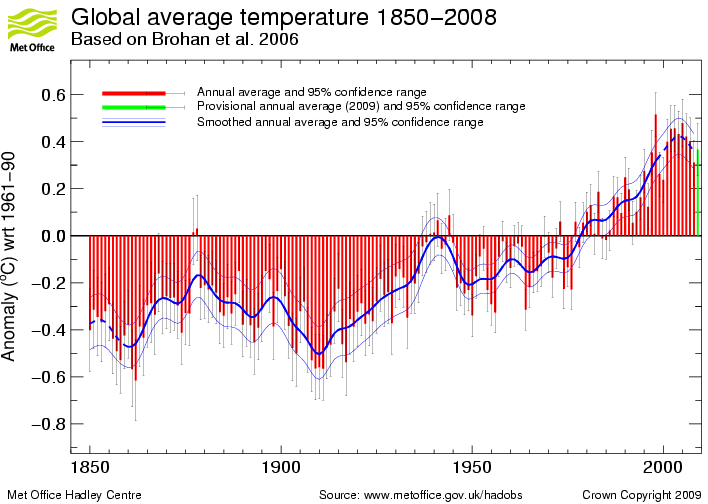
Climate change is already killing 300,000 people a year in a “silent crisis” that is seriously affecting hundreds of millions more, an influential humanitarian group warned today. ... The report claims that 90 per cent of the deaths are related to gradual environmental degradation caused by a warming climate.Whatever those supposed deaths might be attributable to, they cannot be attributed to a warming climate, because THE CLIMATE IS NOT WARMING. It is cooling. Just look at any of the major temperature records:
You'd think that the Times could bother to check with England's own climate office for something as basic as the temperature record, but the problem isn't JUST the press. Like NASA, the Hadley Centre tries to keep the most basic climate-science facts from the public. When temperatures were rising, Hadley cried the global warming threat from the rooftops. Now that the planet is cooling, they are doing their best to cover it up. Here is Hadley's current statement:
The year 2008 was tenth warmest on record, exceeded by 1998, 2005, 2003, 2002, 2004, 2006, 2001, 2007 and 1997They are actually describing a jaggedly descending temperature, but with no mention of the cooling that is occurring. All they say is how warm it still is.
Even those who see themselves as trying to take the reasoned middle ground are misled about the most basic facts. A recent Popular Science editorial claimed that:
...few if any doubt any longer that the warming itself is occurring, given the worldwide rise in surface temperature...HADcrut3 is a surface temperature record. Can PopSci name a single warming skeptic who is ignorant enough think that this record shows that "warming itself is occurring" when it very clearly shows the opposite?
Presumably they mean to refer to the fact that pretty much everybody now acknowledges that there does seem to have been a small amount of warming between the late 70's and 2000, topped off by the El Nino spike of 1998. It did indeed take a while for many skeptics to acknowledge this small amount of warming, for the simple reason that it was not evident in satellite readings (as can be seen in the above graphic with the gray background), while the surface temperature records were known to be tainted with an upward temperature bias, thanks to growing "urban heat island" effects.
No clear warming signal until very late 90’s, then cooling
Pre-98, the alarmists themselves were not yet sure that temperatures were actually rising. Their theory was that CO2 should cause temperatures to rise, and they were watching like hawks for a clear warming signal that they could take as evidence that this theory was right, but it took them a while to get it. In the mid 90's, even the most radical alarmists, like NASA's James Hansen, were only talking about whether or not this predicted signal had been seen yet or not.
They even worked it out so they could claim to see CO2-caused warming in the absence of rising temperatures. Aerosols from coal burning are seen as having a cooling effect, so in the absence of CO2 warming effects, cooling would be expected. Thus so long as temperature readings were not actually showing global cooling, Hansen et. al. could claim that human release of CO2 was having a measurable warming effect. (See for instance, the 1995 IPCC report, summary of the science, p. 22, subhead 4: "The balance of evidence suggests a discernable human influence on global climate.)
With the El Nino spike, it became clear that some warming had occurred. But that was the temperature peak. Since then the surface records and the satellite records all show cooling. Thus the alarmists got essentially one data point that can be taken as supportive of their theory: the very late 90’s did show a clear warming signal. Unfortunately for them, the CO2 theory has no explanation for the rest of the temperature record.
There was no significant human production of CO2 before WWII, so the CO2 theory has no explanation for planetary warming from the Little Ice Age to the 1930s (covering about .8° of the 1°C temperature rise between the Little Ice Age and today). In contrast, the theory that solar-magnetic activity drives climate fits this emergence from Little Ice Age very well: goodbye Maunder Minimum, with hiccups at the Dalton Minimum and the fin-de-1800's minimum.
Ditto for the post-2000 cooling: it does not fit the CO2 theory at all, but fits perfectly with the theory that climate is driven by solar activity.
Comments:
<< Home
I noticed the solar cycle graph too - I was a little surprised to see it. Just eyeballing the graph, it seems pretty clear that the solar cycles have been much more intense in recent decades. Would it be fair to say that the 6 most intense solar cycles in the past 400 years have all occured since 1930?
Nope. Instead, we'll hear how 9 of the 10 hottest years on record have all occured since 1998. Right.
I always enjoy your blog on the subject. Keep up the good work, and hopefully more and more Americans will start to recognize the major shortcomings of AGW theory.
Nope. Instead, we'll hear how 9 of the 10 hottest years on record have all occured since 1998. Right.
I always enjoy your blog on the subject. Keep up the good work, and hopefully more and more Americans will start to recognize the major shortcomings of AGW theory.

I think this is truth because I was watching a Discovery Channel program related to solar activity and temperature and that's terrible because they say that in the 20025 the solar emissions will be terrible and destructive for us.

That cycle decayed as usual to the present quiet leaving solar physicists little to do other than wonder, when would the next cycle begin?
liked all the information. It's very useful and interesting.that was simply awesome to read the post. thanks very much for sharing it....
Post a Comment
<< Home
![]()
